How to Automatically Create PowerPoint Charts From an Excel Data Set
This is a guest article from Yoav Ezer. If you want to guest post on this blog, check out the guidelines here.
Microsoft Office is touted as a complete, integrated office productivity suite. Sometimes though there is a great deal of manual copy, paste and format involved, particularly when working with large data sets.
This is where macros come in. Macros can greatly reduce or even eliminate repetitive tasks.
If you find you have to keep doing the same thing over and over, then investing your time in developing a macro can be very profitable. What many people do not realize is you can use a macro in one Office application to launch a process in another.
In this article we invented a hypothetical situation where you need to create a slide presentation over and over using publicly available data. We take stock data from our large Excel spreadsheet and create charts in PowerPoint so that we can present to the board!
If you want to follow what we did, you may download our Excel file from here.
Steps to Generate Powerpoint Charts From an Excel Data Set
1. The first thing we need to do is gather a realistic data set. To find some raw data we looked to Yahoo! For example, a sample for Microsoft can be found at this link
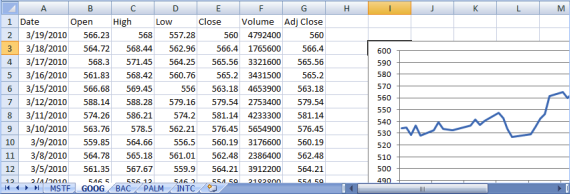
2. Next we created the fully populated workbook. Each sheet contains two months of data for a stock; the stock’s symbol is the sheet’s name.
3. We also created a graph for the first sheet to be used as a template. This template was then copied and changed on all other pages to reflect the appropriate data set.

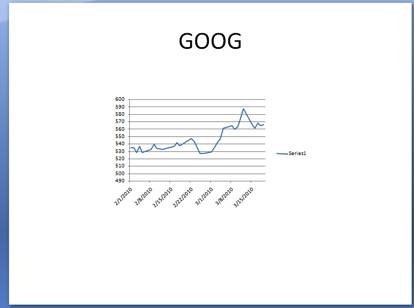
The real solution of course is our macro. The macro creates a PowerPoint presentation, goes over all the pages and creates a slide for each, setting the slide’s title to be the stock symbol, and copies the chart (centering it) as an image into the slide.
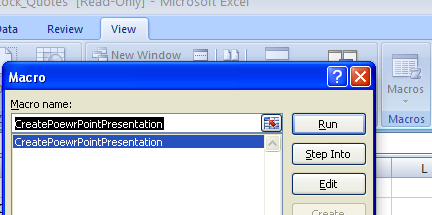
4. You launch the macro by going into View, Macros, select the macro and hit Run.

5. PowerPoint will launch and you will be able to page through all the slides the macro has created.

How it Works
The macro first creates our PowerPoint object and makes it visible (automation has issues if PowerPoint isn’t visible).
PPApp.Visible = True
Next we create a presentation.
Set PPPres = PPApp.Presentations.Add
PPApp.ActiveWindow.ViewType = ppViewSlide
Once we have a presentation created we can go over the active workbook’s sheets and add each chart to the presentation as a slide. Adding the charts is a matter of adding the slide, copying and pasting the shape, then centering on the slide.
For iSheet = 1 To ActiveWorkbook.Worksheets.Count
‘ Get the sheet
Set ExcelSheet = ActiveWorkbook.Worksheets(iSheet)
‘ First add a slide
Set PPSlide = PPPres.Slides.Add(iSheet, ppLayoutTitleOnly)
PPSlide.Shapes(1).TextFrame.TextRange.Text = ExcelSheet.Name
ExcelSheet.Shapes(1).Copy
PPSlide.Shapes.PasteSpecial ppPasteShape
PPSlide.Shapes(2).Left = (PPPres.PageSetup.SlideWidth – PPSlide.Shapes(2).Width) / 2
PPSlide.Shapes(2).Top = (PPPres.PageSetup.SlideHeight – PPSlide.Shapes(2).Height) / 2
Next
After that is done all we have left to do is to clean up.
Set PPSlide = Nothing
Set PPPres = Nothing
Set PPApp = Nothing
End Sub
Summary
Next time you have a whole bunch of slides to create from your Excel data you could save yourself a lot of copying and pasting, but more importantly you can see how the Microsoft Office suite truly is integrated and you have powerful access to that integration from within the macro programming!
Yoav is the CEO of Cogniview, a company that creates PDF to XLS conversion software. Prior to that, Yoav Ezer was the CEO of Nocturnus, a technology-centered software solution company. For more Excel tips from Yoav, join him on Facebook or Twitter.