Check Your Site’s Loading Time On Different Geographic Locations
If you run a website, write a blog or provide any web service – the loading time of your site is a critical factor. No one likes a slow website which takes ages to load, web visitors have a very short attention span so you should routinely monitor your site’s loading time and take proper steps in reducing the overall loading time of your website.
We have earlier discussed different tools to measure the load time of a blog or website. This includes using Google Webmaster tools to measure the average load time of a website and load or stress testing a website for large traffic. Then there are different tools e.g Pingdom for measuring a website loading time but there is a serious disadvantage in all of them.
None of these tools can measure the loading time from different geographic locations or browsers. Well, you may want to find out how fast your site loads from a broadband connection in US and how fast your site loads from a generic dial up connection from any other country. All the load time monitoring tools provide an average report which might not be very effective or specific for different ISP’s across the globe.
This is where Loads.in proves to be handy – the site lets you find the loading time of any website from different countries and browsers.
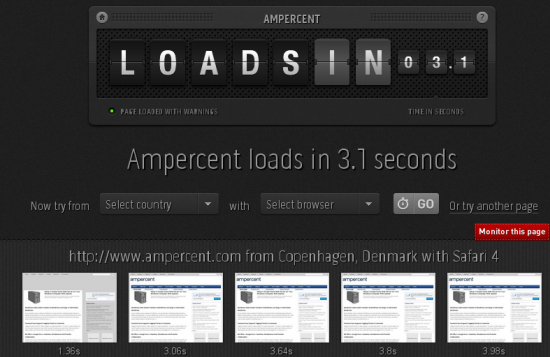
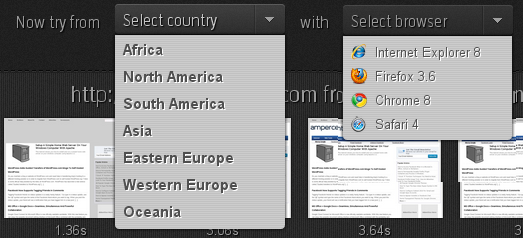
Using the site is fairly simple, all you have to do is key in the address of the website, choose the countries and the browser. Then hit the “Go” button and the tool will fetch the loading time of your website for that specific country and browser combination. In addition, you will also be shown a thumbnail preview of your site’s design and how it looks on the client side, which is handy if you want to test your site’s design compatibility for different browsers and resolutions.
Supported browsers include Internet Explorer 8, Firefox 3.6, Google Chrome 8 and Safari 4 (No opera). There is no support for IE6, though you can use Microsoft Superpreview to test your site’s design compatibility For Internet Explorer 6 and 7
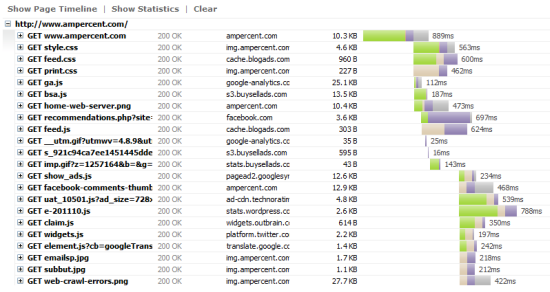
There is more, loads.in will also perform a check on your site’s HTML code and throw in error reports when it finds one. You can click the waterfall chart to find the loading time of specific components and files e.g CSS, JS, Images and other HTML objects. This helps in figuring out what’s slowing down your website and which objects needs to be removed or optimized for better loading of your website’s pages.
Benchmarking Reports
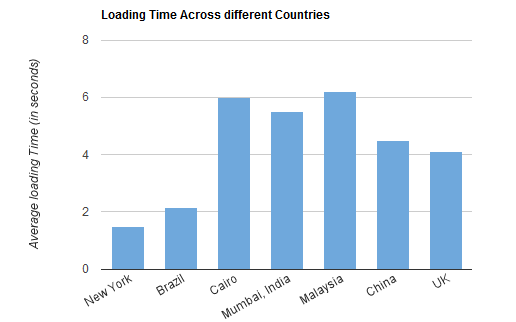
You can perform the tests using different countries and browser combinations and use the report for benchmarking. This will help you find out the regions where your site takes ages to load, so you can decide on your site’s internal architecture and optimize the code for more faster performance.
We tested Loads.in with this tech blog and following were the results (testing was carried out using Google Chrome, Firefox and Safari)
[ via Snaphow.com ]
Related tip: Improve your site’s loading time by loading images on demand
